Measuring Performance With Server Timing
Measuring Performance With Server Timing
Drew McLellan
When undertaking any sort of performance optimisation work, one of the very first things we learn is that before you can improve performance you must first measure it. Without being able to measure the speed at which something is working, we can’t tell if the changes being made are improving the performance, having no effect, or even making things worse.
Many of us will be familiar with working on a performance problem at some level. That might be something as simple as trying to figure out why JavaScript on your page isn’t kicking in soon enough, or why images are taking too long to appear on bad hotel wifi. The answer to these sorts of questions is often found in a very familiar place: your browser’s developer tools.
Over the years developer tools have been improved to help us troubleshoot these sorts of performance issues in the front end of our applications. Browsers now even have performance audits built right in. This can help track down front end issues, but these audits can show up another source of slowness that we can’t fix in the browser. That issue is slow server response times.
Time to First Byte
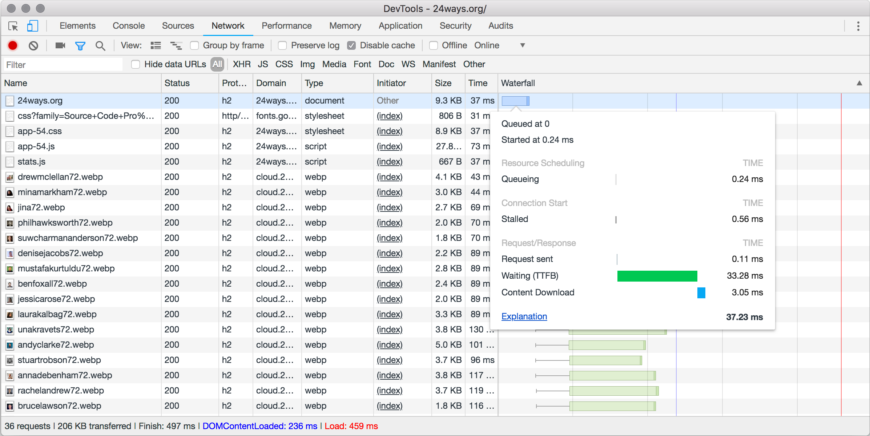
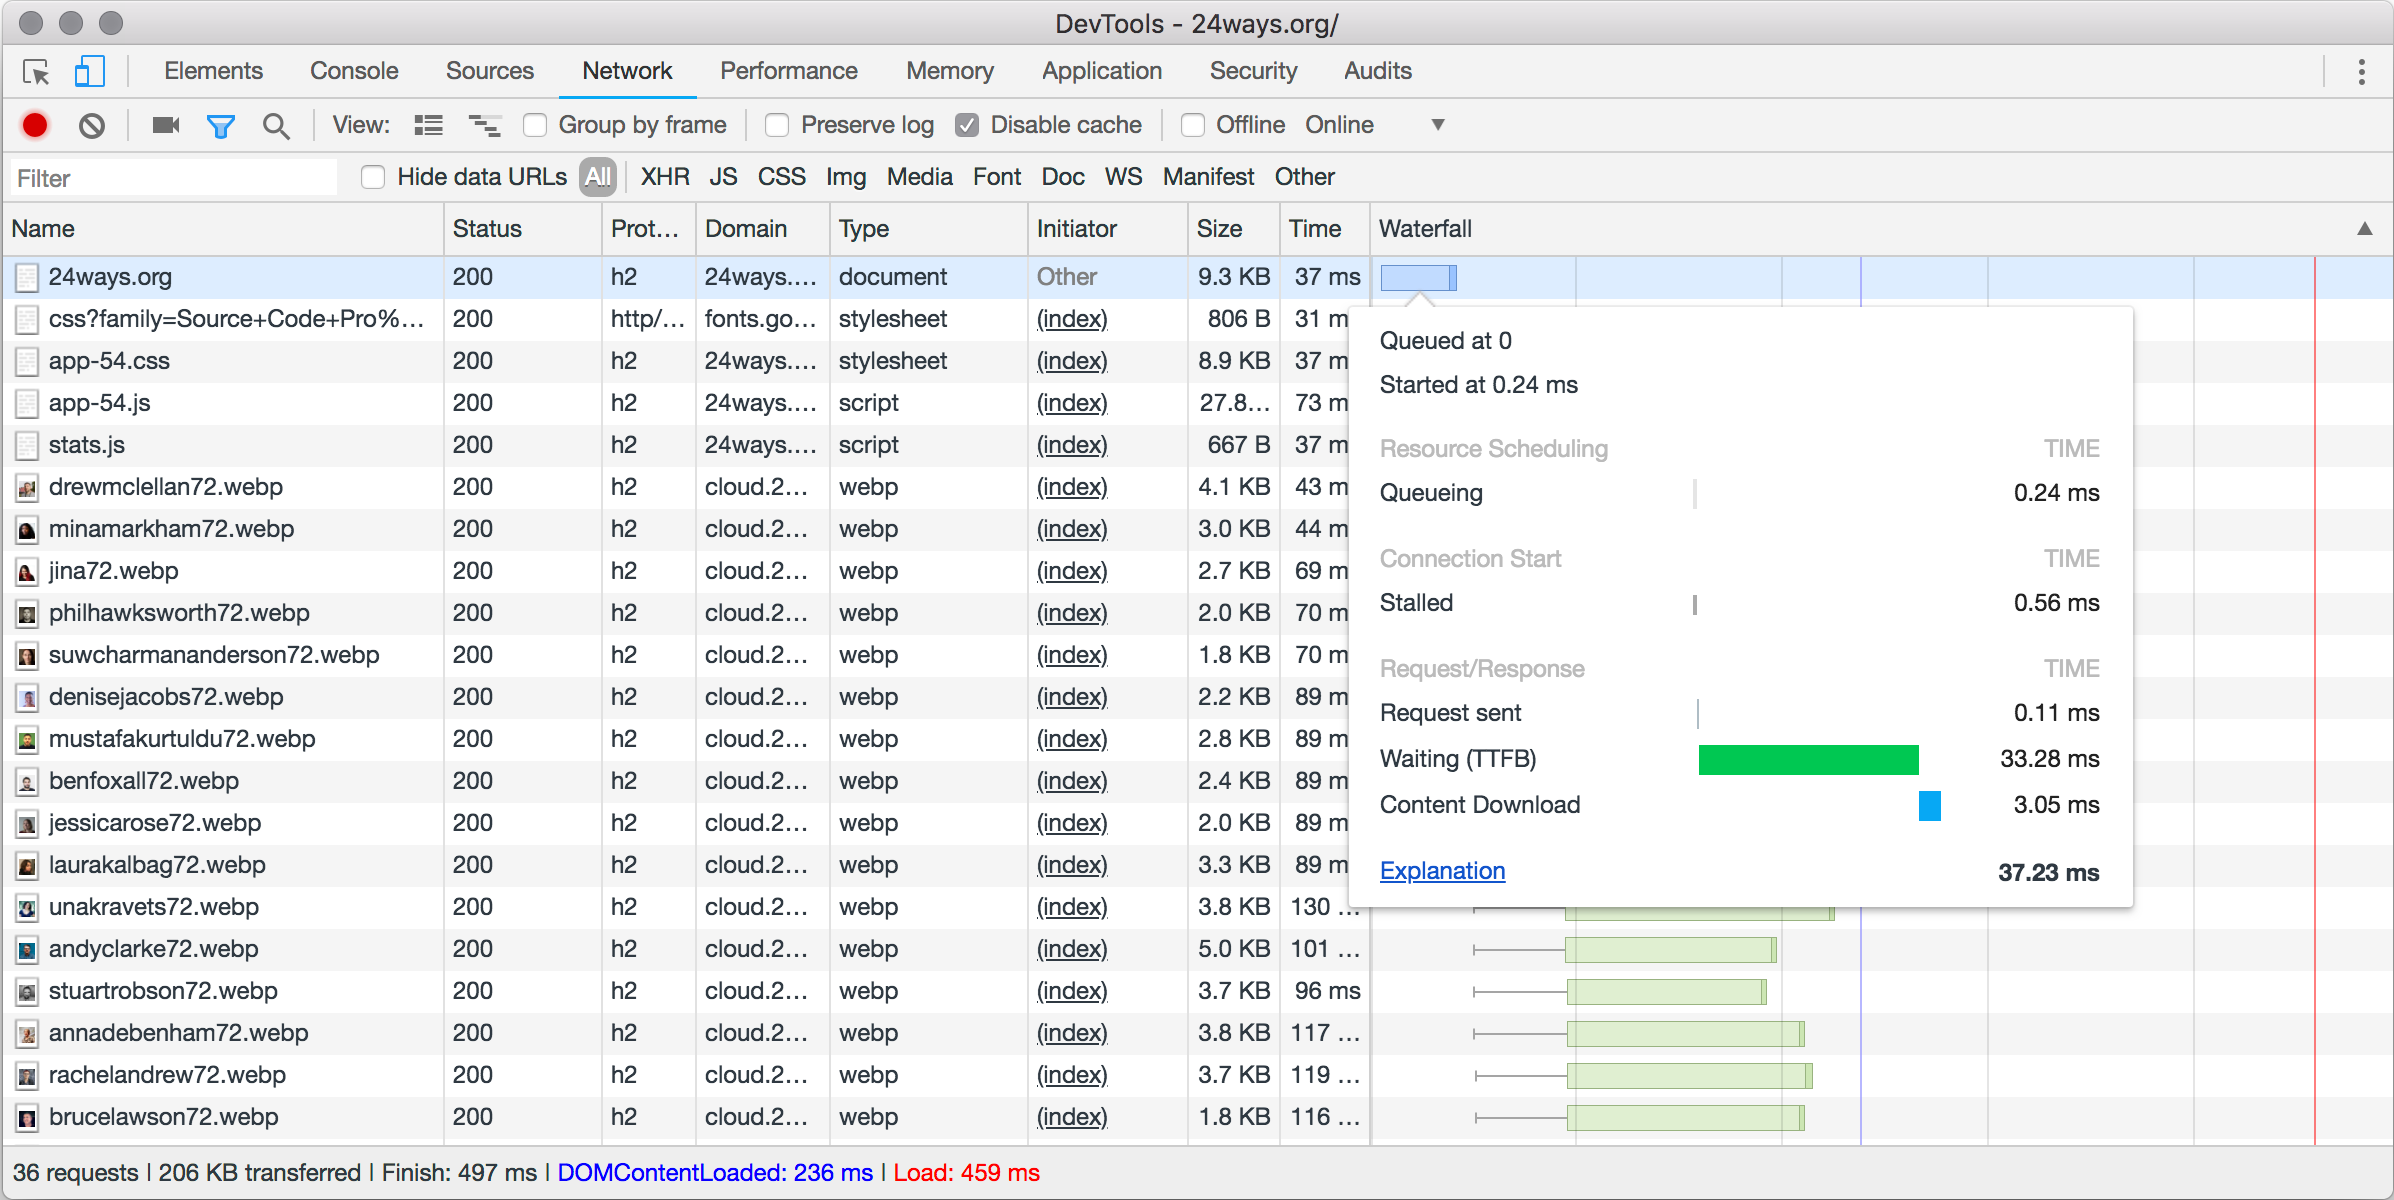
There’s very little browser optimisations can do to improve a page that is simply slow to build on the server. That cost is incurred between the browser making the request for the file and receiving the response. Studying your network waterfall chart in developer tools will show this delay up under the category of “Waiting (TTFB)”. This is how long the browser waits between making the request and receiving the response.
In performance terms this is know as Time to First Byte – the amount of time it takes before the server starts sending something the browser can begin to work with. Encompassed in that wait time is everything the server needs to do to build the page. For a typical site, that might involve routing the request to the correct part of the application, authenticating the request, making multiple calls to backend systems such as databases and so on. It could involve running content through templating systems, making API calls out to third party services, and maybe even things like sending emails or resizing images. Any work that the server does to complete a request is squashed into that TTFB wait that the user experiences in their browser.

So how do we reduce that time and start delivering the page more quickly to the user? Well, that’s a big question, and the answer depends on your application. That is the work of performance optimisation itself. What we need to do first is measure the performance so that the benefit of any changes can be judged.
The Server Timing Header
The job of Server Timing is not to help you actually time activity on your server. You’ll need to do the timing yourself using whatever toolset your backend platform makes available to you. Rather, the purpose of Server Timing is to specify how those measurements can be communicated to the browser.
The way this is done is very simple, transparent to the user, and has minimal impact on your page weight. The information is sent as a simple set of HTTP response headers.
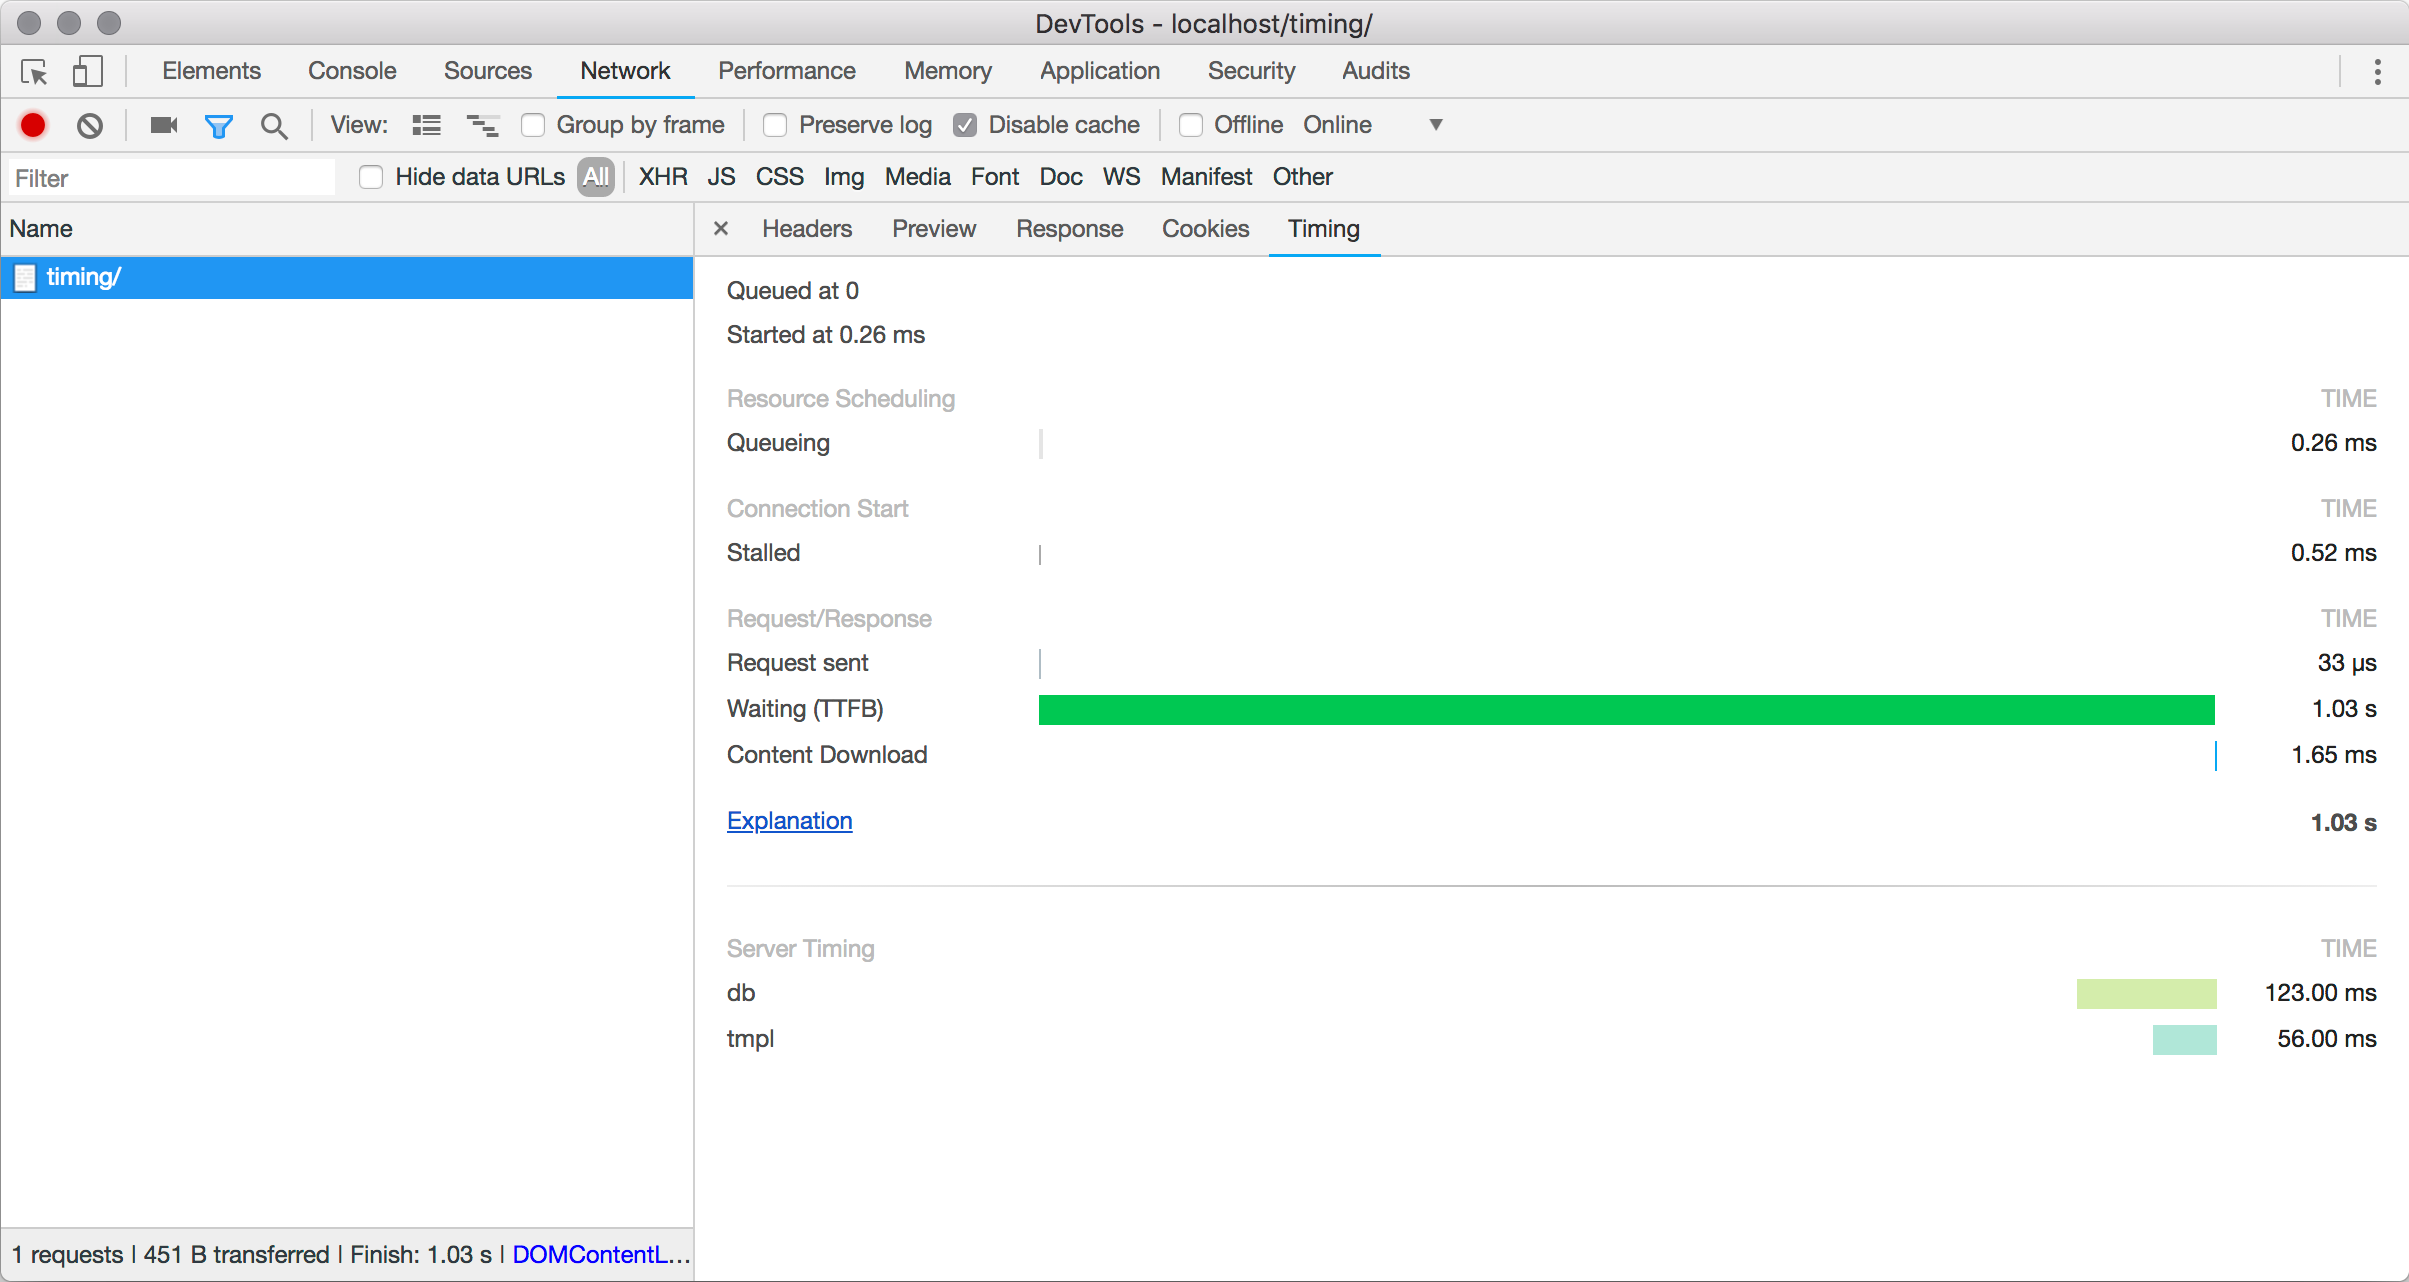
Server-Timing: db;dur=123, tmpl;dur=56This example communicates two different timing points named db and tmpl. These aren’t part of the spec – these are names that we’ve picked, in this case to represent some database and template timings respectively.
The dur property is stating the number of milliseconds the operation took to complete. If we look at the request in the Network section of Developer Tools, we can see that the timings have been added to the chart.

The Server-Timing header can take multiple metrics separated by commas:
Server-Timing: metric, metric, metricEach metric can specify three possible properties
- A short name for the metric (such as
dbin our example) - A duration in milliseconds (expressed as
dur=123) - A description (expressed as
desc="My Description")
Each property is separated with a semicolon as the delimiter. We could add descriptions to our example like so:
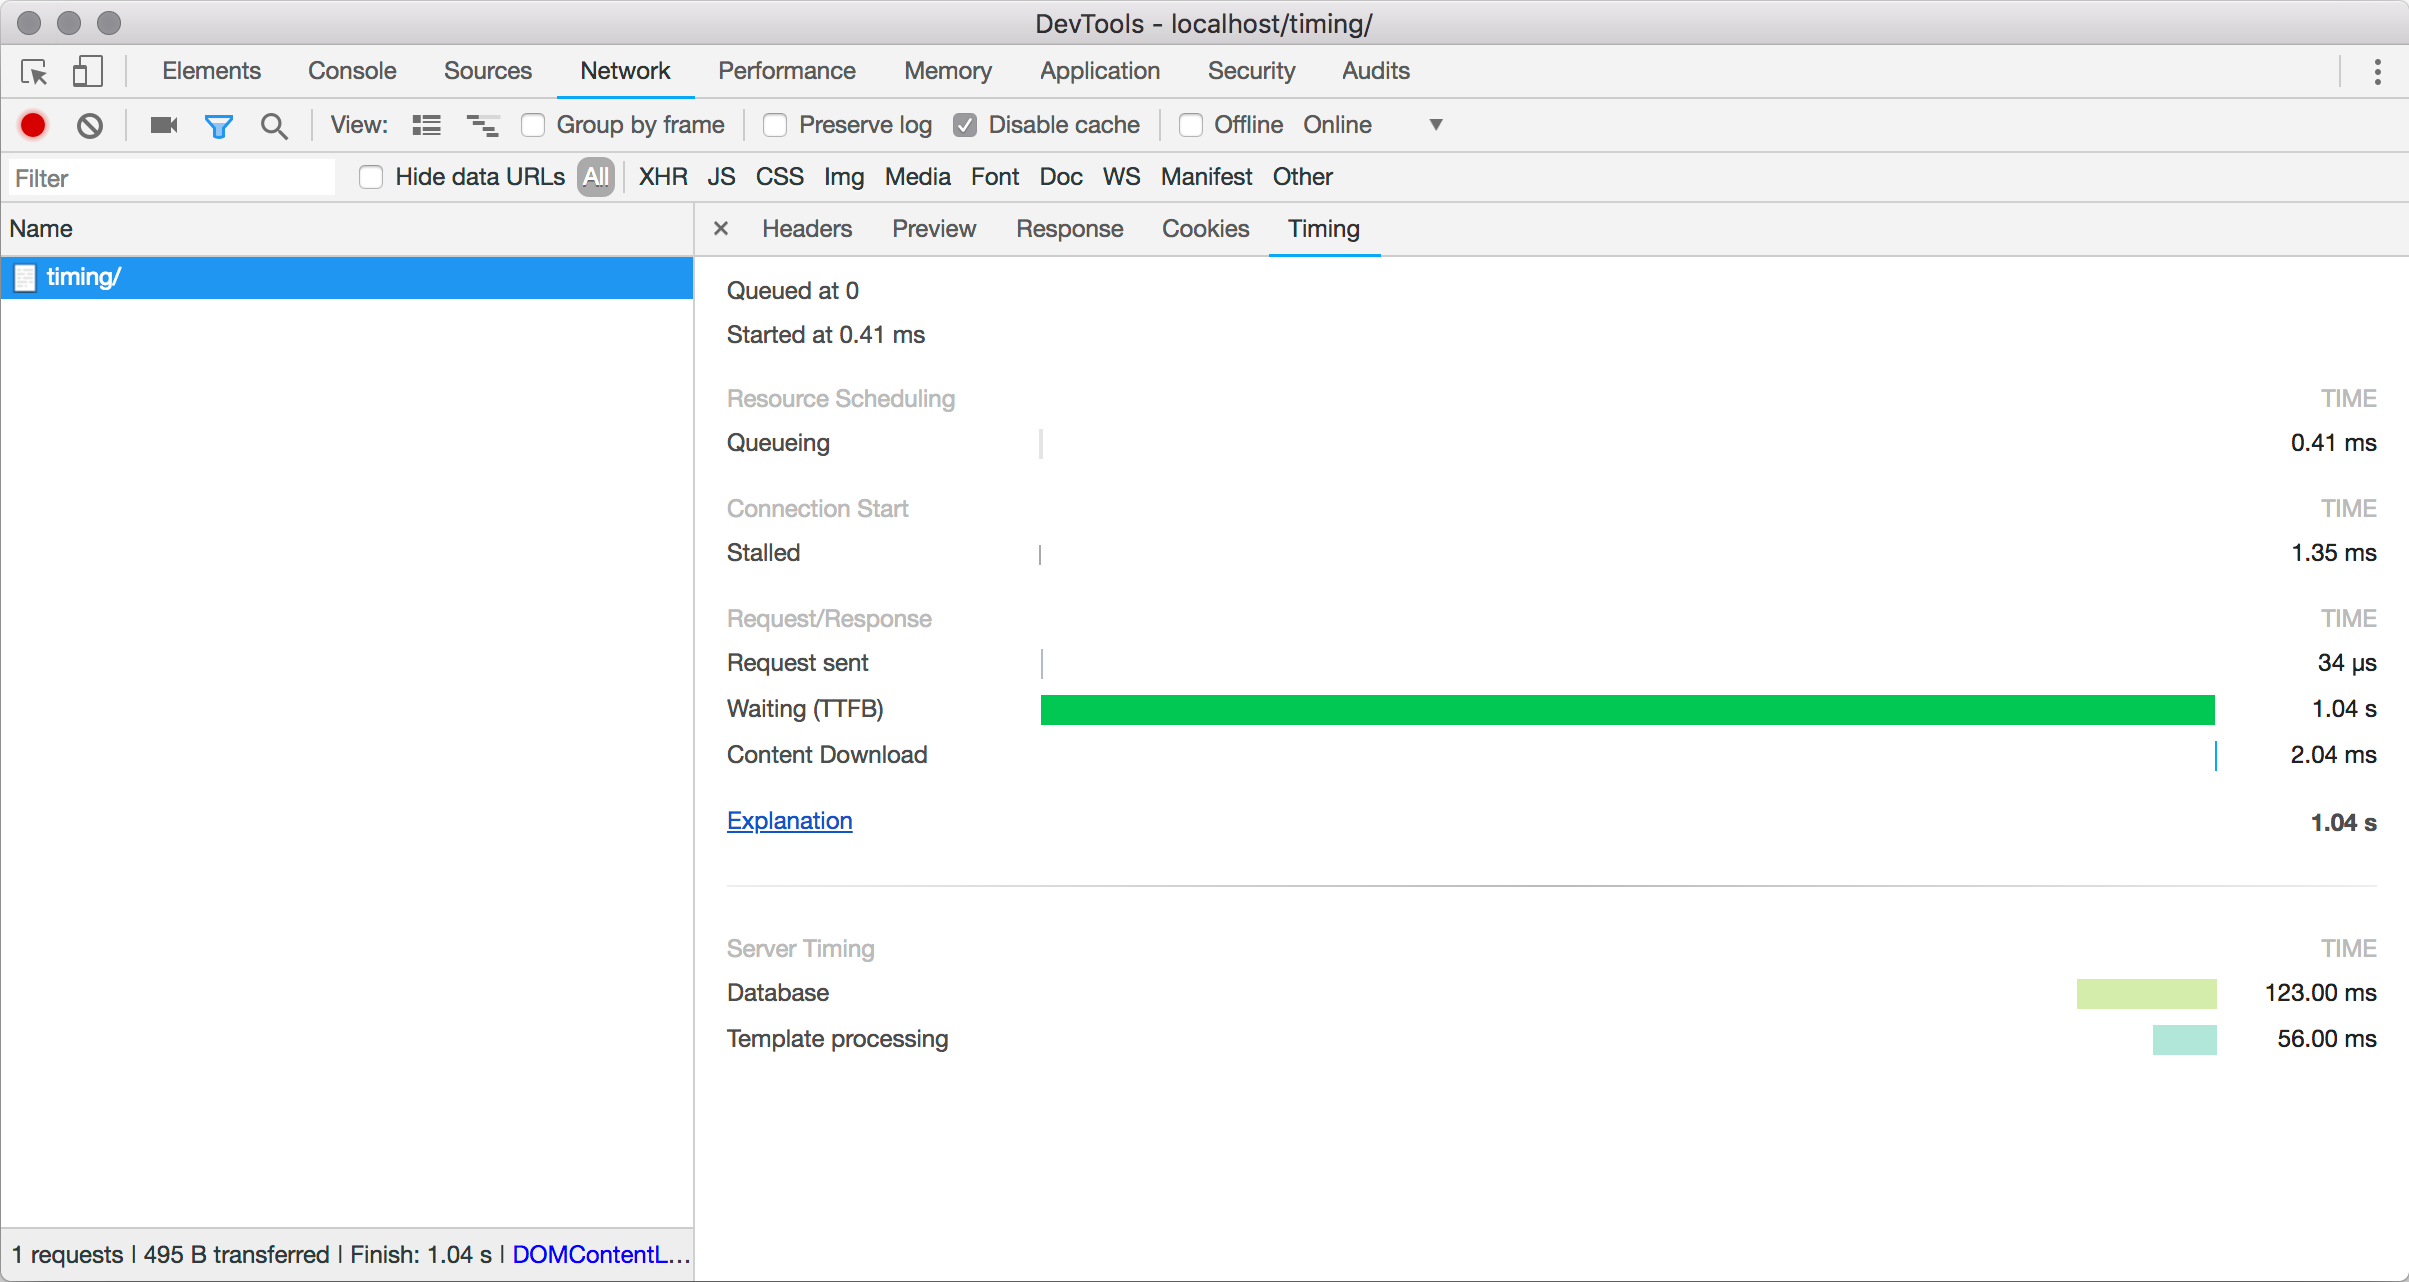
Server-Timing: db;dur=123;desc="Database", tmpl;dur=56;desc="Template processing"
The only property that is required is name. Both dur and desc are optional, and can be used optionally where required. For example, if you needed to debug a timing problem that was happening on one server or data center and not another, it might be useful to add that information into the response without an associated timing.
Server-Timing: datacenter;desc="East coast data center", db;dur=123;desc="Database", tmpl;dur=56;desc="Template processing”This would then show up along with the timings.

One thing you might notice is that the timing bars don’t show up in a waterfall pattern. This is simply because Server Timing doesn’t attempt to communicate the sequence of timings, just the raw metrics themselves.
Implementing Server Timing
The exact implementation within your own application is going to depend on your specific circumstance, but the principles are the same. The steps are always going to be:
- Time some operations
- Collect together the timing results
- Output the HTTP header
In pseudocode, the generation of response might look like this:
startTimer('db') getInfoFromDatabase() stopTimer('db') startTimer('geo') geolocatePostalAddressWithAPI('10 Downing Street, London, UK') endTimer('geo') outputHeader('Server-Timing', getTimerOutput())The basics of implementing something along those lines should be straightforward in any language. A very simple PHP implementation could use the microtime() function for timing operations, and might look something along the lines of the following.
class Timers { private $ timers = []; public function startTimer($ name, $ description = null) { $ this->timers[$ name] = [ 'start' => microtime(true), 'desc' => $ description, ]; } public function endTimer($ name) { $ this->timers[$ name]['end'] = microtime(true); } public function getTimers() { $ metrics = []; if (count($ this->timers)) { foreach($ this->timers as $ name => $ timer) { $ timeTaken = ($ timer['end'] - $ timer['start']) * 1000; $ output = sprintf('%s;dur=%f', $ name, $ timeTaken); if ($ timer['desc'] != null) { $ output .= sprintf(';desc="%s"', addslashes($ timer['desc'])); } $ metrics[] = $ output; } } return implode($ metrics, ', '); } }A test script would use it as below, here using the usleep() function to artificially create a delay in the running of the script to simulate a process that takes time to complete.
$ Timers = new Timers(); $ Timers->startTimer('db'); usleep('200000'); $ Timers->endTimer('db'); $ Timers->startTimer('tpl', 'Templating'); usleep('300000'); $ Timers->endTimer('tpl'); $ Timers->startTimer('geo', 'Geocoding'); usleep('400000'); $ Timers->endTimer('geo'); header('Server-Timing: '.$ Timers->getTimers());Running this code generated a header that looked like this:
Server-Timing: db;dur=201.098919, tpl;dur=301.271915;desc="Templating", geo;dur=404.520988;desc="Geocoding"
Existing Implementations
Considering how handy Server Timing is, there are relatively few implementations that I could find. The server-timing NPM package offers a convenient way to use Server Timing from Node projects.
If you use a middleware based PHP framework tuupola/server-timing-middleware provides a handy option too. I’ve been using that in production on Notist for a few months, and I always leave a few basic timings enabled if you’d like to see an example in the wild.
For browser support, the best I’ve seen is in Chrome DevTools, and that’s what I’ve used for the screenshots in this article.
Considerations
Server Timing itself adds very minimal overhead to the HTTP response sent back over the wire. The header is very minimal and is generally safe to be sending without worrying about targeting to only internal users. Even so, it’s worth keeping names and descriptions short so that you’re not adding unnecessary overhead.
More of a concern is the extra work you might be doing on the server to time your page or application. Adding extra timing and logging can itself have an impact on performance, so it’s worth implementing a way to turn this on and off when required.
Using a Server Timing header is a great way to make sure all timing information from both the front-end and the back-end of your application are accessible in one location. Provided your application isn’t too complex, it can be easy to implement and you can be up and running within a very short amount of time.
If you’d like to read more about Server Timing, you might try the following:
- The W3C Server Timing Specification
- The MDN page on Server Timing has examples and up to date detail of browser support
- An interesting write-up from the BBC iPlayer team about their use of Server Timing.
 (ra)
(ra)
Articles on Smashing Magazine — For Web Designers And Developers
